Mitsubishi Electric Corporation (TOKYO: 6503) announced today that the company’s new EcoAdviser data-analysis and diagnostic software (MES3-EAP1-AI) for increased energy savings at manufacturing facilities will be released on October 26. The innovative new software uses Mitsubishi Electric’s Maisart®*-branded artificial-intelligence (AI) technology for highly effective energy-saving functions, such as identifying energy losses, diagnosing potential energy-loss factors and quantifying the expected effects of energy-saving measures.
Energy efficiency and energy conservation continue to gain importance as the monetary and environmental costs of energy steadily rise. To mitigate such costs, new technologies such as AI and the Internet of Things (IoT) are expected to help realize effective energy-saving solutions at production sites. Mitsubishi Electric’s new EcoAdviser software will provide energy-saving data analysis and diagnostics-based recommendations that go beyond simple visualization to support meaningful energy-saving solutions in the manufacturing sector.


Key Features
- 1)Maisart AI and 5-point methodology automatically identify energy losses in manufacturing
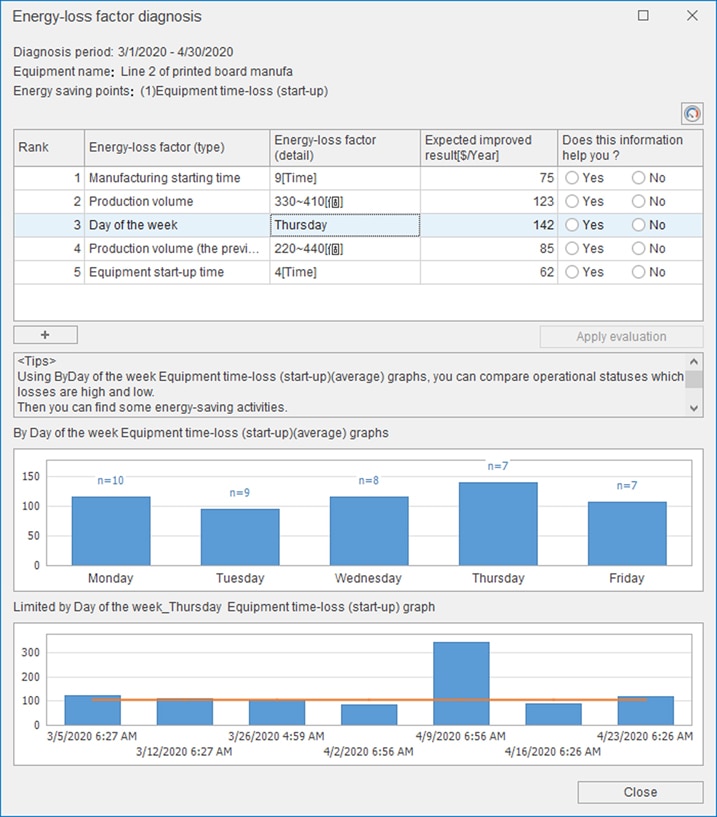
Previously, factories needed to perform continuous self-analysis building on data collected and field inspection results in order to determine energy loss. EcoAdviser identifies and quantifies energy losses based on AI analysis and Mitsubishi Electric’s five-point methodology: 1. equipment time-loss when starting up, 2. equipment time-loss when shutting down, 3. operational time-loss of utility equipment, 4. non-operation rate of equipment, and 5. specific energy consumption. Factors closely correlating with energy loss such as date and time, equipment and so on are prioritized in terms of potential for reducing losses through recommended countermeasures. Also, key points are clarified to ensure effective energy-saving measures. Factor diagnosis steadily improves as AI learns conditions and ongoing results. - 2)Visualization of improvements realized through energy-saving initiatives
Users can quickly confirm the scope of improvement through before-and-after comparisons of results. By continuously analyzing the effectiveness energy-saving countermeasures in a quantitative manner, improvements can be steadily enhanced by separately reviewing the effectiveness of each initiative. - 3)Customizable energy dashboard enables diverse analytics
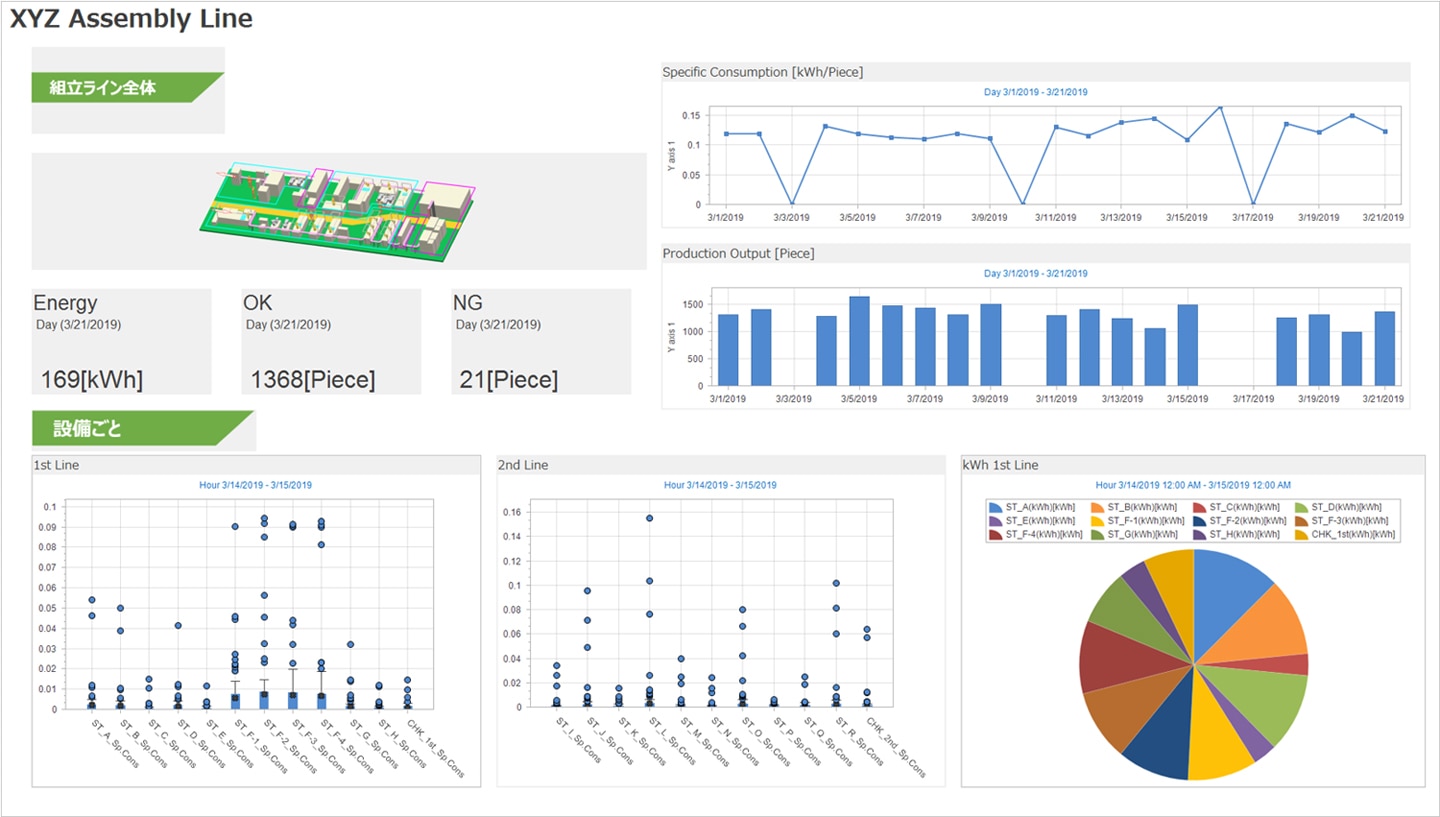
A customizable dashboard allows users to focus on priority issues and key performance indicators (KPIs). Additionally, empirical evidence has shown that sharing energy KPI data with factory workers on large displays in a worksite promotes greater awareness and more attention to energy saving. EcoAdviser offers diverse analytical graphics, including pie charts, rankings, time series, box plots, scatter diagrams, pareto charts and histograms.

