Accuracy in data analytics sparks through the tools that we use. Check out our top 12 data analytics tool picks that every data analyst will require in 2021
What are Data Analytics Tools and why do you need them?
To be able to perform data analysis to get accurate results, people behind these processes will use tools and software – that will ensure the best results. There are many of them in the market, data analysts must choose wisely in order to help them analyse better. Here we will be covering the best data analyst tools and name key features of each based on different types of analysis processes.
To make the most of it, to make the best possible decision as an analyst, which software you should be choosing? Here we have compiled a list of the top data analyst tools which comes with various features.
1. Business Intelligence Tools
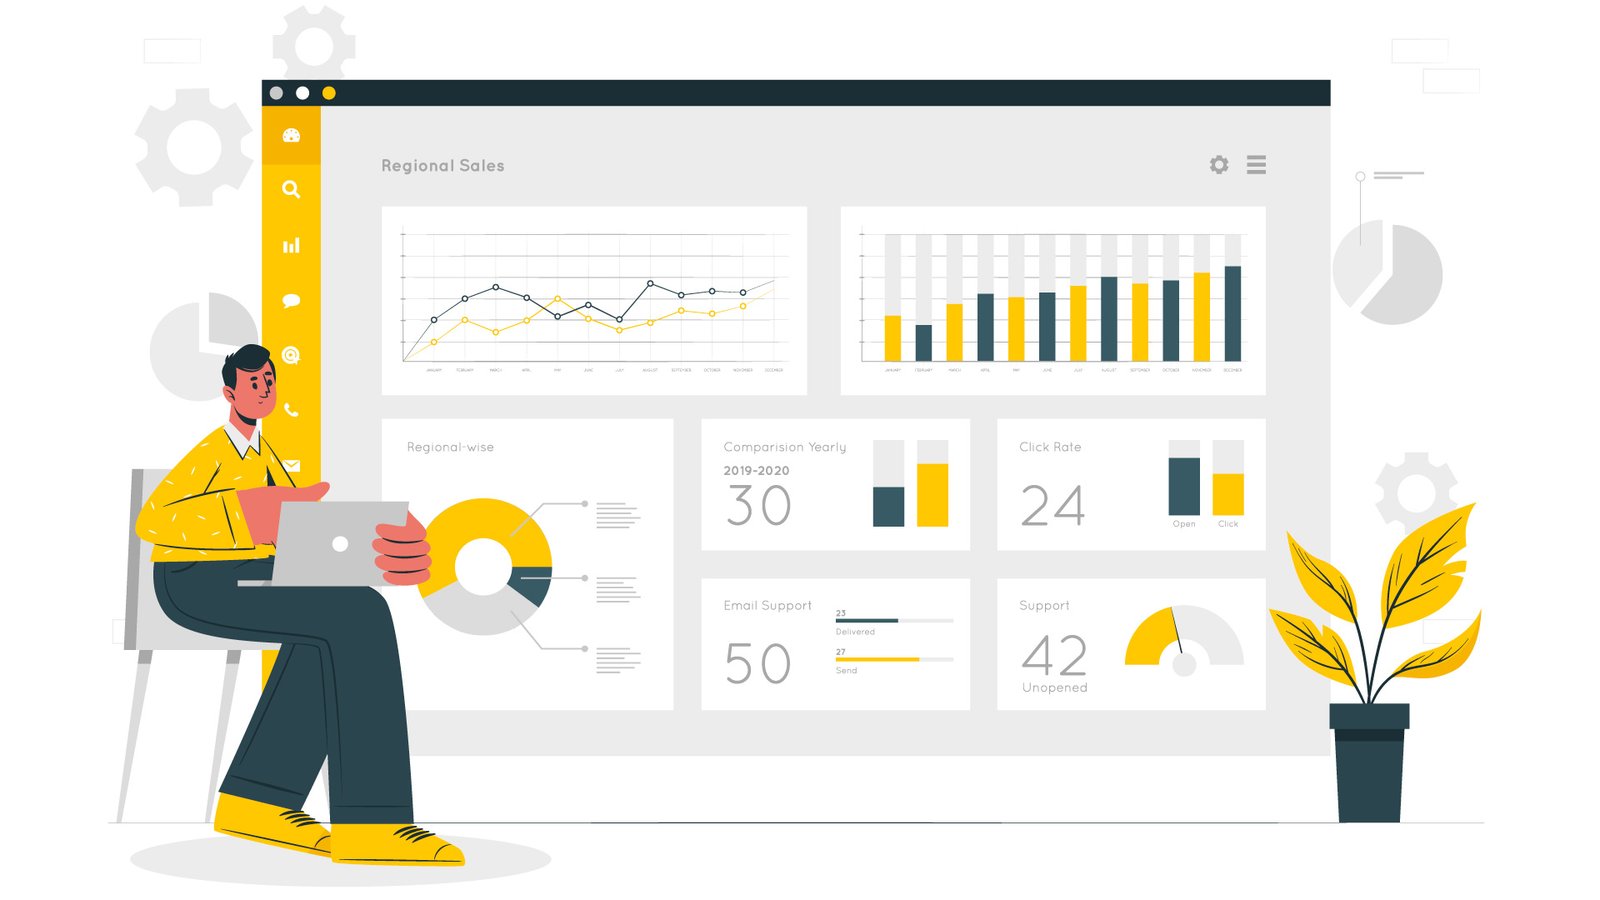
Business Intelligence tools are one of the most represented means of performing data analysis. They are specialised in business analytics, these tools will prove to be beneficial for every data analyst which need to be analysed, monitor and report on important findings. Features like self-service, predictive analytics, and advanced SQL modes make such solutions easily adjustable to every level of knowledge.
Datapine is one of the best software – which covers most of the requirements both for beginner and advanced users. It comes with the key features like Visual drag-and-drop interface with an easy switch to advanced SQL mode, powerful predictive analytics features and interactive charts and dashboard and smart alarm systems which triggers when anomaly occurs.
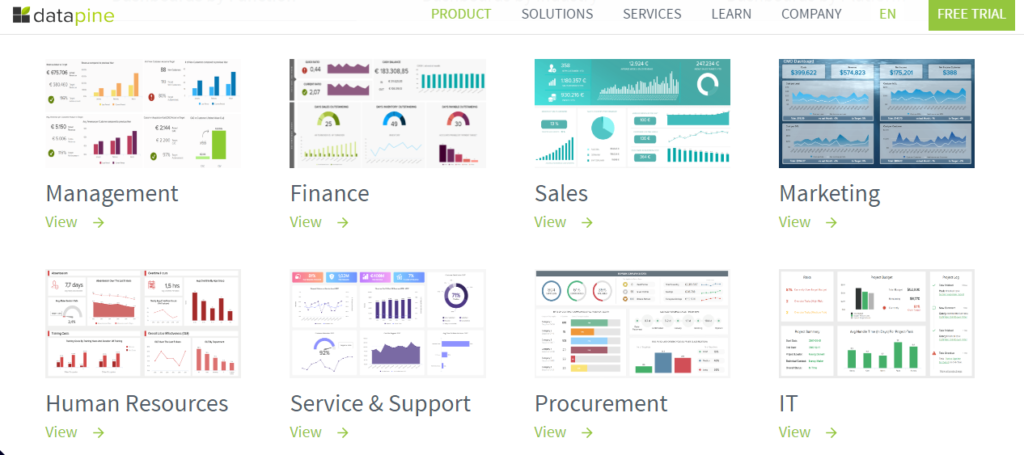
As we can gauge from the snippet taken from Datapine’s website below they have customized business intelligence solutions for varied industry verticals that not only eases the performance but also optimizes the work.
2. Statistical Analysis Tools
What is it? Referring to computation techniques which usually contain a variety of statistical techniques to manipulate, explore and generate insights – and there are multiple programming languages to make data scientists’ work easier and more effective. Science and Technology comes with its own set of rules and regulations which will need special attention when it comes to statistical data analysis and modelling.
Let’s understand one of the most popular tools for a data analyst – R programming. R programming is built by R-studio. It comes with the key features of an ecosystem of more than 10,000 packages and extensions for various types of data analysis, statistical analysis, modelling and hypothesis testing and active and communicative community of researchers, statisticians and scientists.

3. Programming Languages
As we all know, programming languages are used to solve a variety of data problems. Let’s focus on the generic one that uses letters, numbers, and symbols to create programs and require formal syntax used by programmers. Generally they are also called text-based programs because you need to write software that will ultimately solve a problem.
For instance, include C#, Java, PHP, Ruby, Julia and Python, among many others on the market. But our take on one of the best tools for data analysts that have coding knowledge as well is Python. Python is an open-source solution that has simple coding processes and syntax for easy to learn. It comes with the integration with other languages such as C/C++, Java, PHP, C#, etc. Plus has the quality like advanced analysis processes through machine learning and text mining.

4. SQL Consoles
SQL is a programming language that is used to manage/query data held relational databases, particularly effective in handling structured data as a database tool for analysts. SQL consoles is highly popular in the data science community and one of the analyst tools used in various business cases and data scenarios.
As most of the data is stored in relations databases and you need to access and unlock its value, SQL is a highly critical component of succeeding in business, and by learning it, analysts can offer a competitive advantage to their skillset.
There are multiple SQL based database management systems available like MySQL, PostgreSQL, MS SQL and Oracle, but we would recommend MySQL to the most. It comes with a unified visual tools for data modelling, SQL development, administration, backup, etc. Instant access to database schema and objects via the Object Browser, SQL Editor which offers colour syntax highlighting, reuse of SQL snippets, and execution history.
5. Standalone Predictive Analytics Tools
Predictive analytics is one of the advanced techniques, used by analysts which combine data mining, machine learning, predictive modelling, and artificial intelligence to predict future events. It is one of the most popular tools in data analysis. We focus on standalone, advanced predictive analytics that companies use for multiple reasons, from detecting fraud with the help of pattern detection to optimizing marketing by analysing consumers’ behaviour and purchases.
We recommend SAS Forecasting for the same. It is an automatic forecasting for a large number of entities or products, including hierarchical forecasting, scalability and modelling by combining 2 or more models and creating an ensemble. It comes with a model repository which includes time series and causal methods such as ARIMA and ARIMAX.
6. Data Modelling Tools
Creating models to structure the database and design business systems by utilizing diagrams, symbols and text, ultimately represent how the data flows and is connected in between. Businesses use data modelling tools to determine the exact nature of the information they control and the relationship between datasets.
We recommend Erwin Data Modeller (EDM), one of the most popular data analyst software used to create models and design your data assets. It has automated data model generation to increase productivity in analytical processes, single interface no matter the location or the types of data, and 7 different versions of the solution you can choose from and adjust based on your business requirements.
7. ETL (Extract, Transform, Load) Tools
ETL is a process used by companies, no matter the size, across the world, and if a business grows, chances are you will need to extract, load and transform the data in another database to be able to analyse it and build queries. There are 3 types of ETL tools; batch ETL, real-time ETL and cloud-based ETL.
There are many tools in the market, but one of the most popular one is Talend. It collects and transforms data through data preparation, integration, and cloud pipeline designer. It comes with a data governance feature to build a data hub and resolve any issues in data quality plus sharing data through comprehensive deliveries via APIs.
8.Unified Data Analytics Engines
It is basically for all the SMBs and big companies – who produce massive datasets and need big data management solutions, then unified data analytics engines that might be the best solution for your analytical processes. To make quality and accurate decisions in a big data environment analysts will need a tool that will enable them to take full control of the company’s robust data environment.
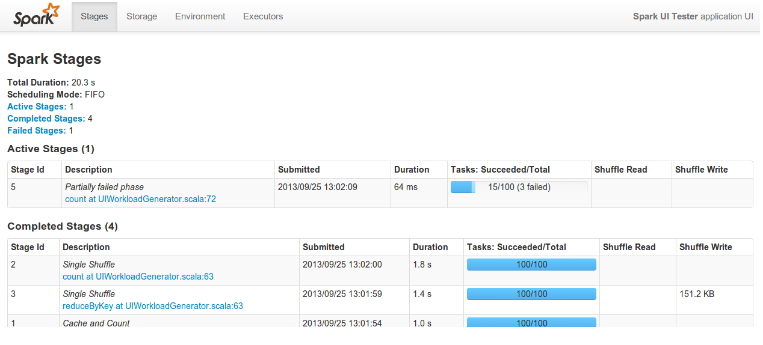
Apache Spark is one of the most popular one and the one which supports big scale data processing with the help of an extensive ecosystem. It is with the high performance, a large ecosystem of data frames, streaming, machine learning and graph computation. A collection of over 100 operators for transforming and operating on large scale data.
As we can figure out from the Apache Spark’s image below, it displays a variety of monitoring data in a web UI. The existing storage has been extended and additional pages have been added to display total storage and task information per-executor.
9. Spreadsheet Applications
Spreadsheets are one of the most traditional and basic forms of data analysis. It is quite popular in any industry or business or organization. There is a 0.1% chance where you have never interacted with a spreadsheet to analyse your data. Usually the ones who are not well versed with the highly technical knowledge of data analyses – they tend to use the spreadsheets.
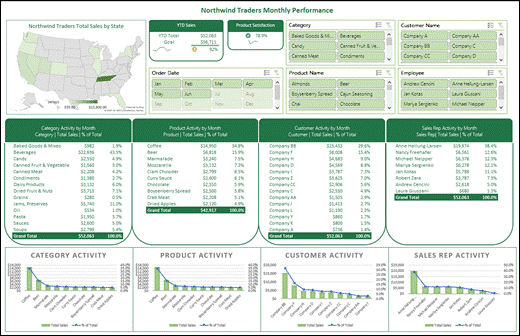
We have chosen Microsoft Excel as one of the most popular in business. It comes with the features like Pivot Tables and works pretty well in building complex equations through designated rows and columns. It is perfect for smaller analysis processes through workbooks and quick sharing.
As we can see in the below snippet, dashboard of Microsoft Excel represents the key metrics that allow you to quickly view and analyse your data in one place.
10. Industry-Specific Analytics Tools
There are solutions which are specifically developed to accommodate a single industry and cannot be used in another. Although there are many industry-specific data analysis programs and software, here check out which one we are recommending!
Qualtrics – one of the leading research software which is used by over 10,000 world’s brands and has over 2M users across the globe as well as many industry-specific features focused on market research. It comes with 4 main experience features – i.e. customer, brand, employee and product. Plus their in-house experts provide assistance. And advanced statistical analysis with their Stats iQ analysis tool.
11. Data Science Platforms
If you need to utilize preparation, integration or data analyst report tools, data science platforms would be high on your list for simplifying analytical processes and utilizing advanced analytics models to generate in-depth data science insights.
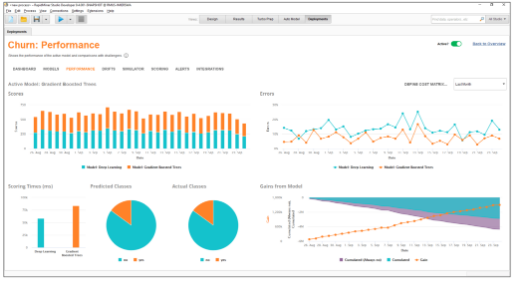
We recommend RapidMiner as one of the top data analyst software which combines deep but simplifies analysis. It comes with a comprehensive data science and machine learning platform with more than 1500 algorithms, it is possible to integrate with Python and R as well as support for database connections. Plus advanced analytics features for descriptive and prescriptive analytics
As we can see from the website below, RapidMiner offers an easy way for business users to put models into production.
12. Data Visualization Tools & Platforms
Data visualization has become an indispensable tool in analysis processes. There are differences between professional data visualization tools often integrated through already mentioned Business Intelligence tools, free available solutions as well as paid charting libraries. They are different.
We recommend Highcharts as one of the most popular charting libraries on the market. It is an interactive JavaScript engine for charts that are used in web and mobile projects. It is designed by keeping developers in the centre. WebGL-powered boost modules render millions of data points directly in the browser.